Файл:Newton iteration.png

Матеріал з Вікіпедії — вільної енциклопедії.
Перейти до навігації Перейти до пошуку

Повна роздільність(2406 × 1978 пікселів, розмір файлу: 55 КБ, MIME-тип: image/png)

Wikimedia Commons logo Відомості про цей файл містяться на Вікісховищі — централізованому сховищі вільних файлів мультимедіа для використання у проектах Фонду Вікімедіа.

Опис файлу

Є векторний варіант цього зображення (SVG).
Його слід використовувати замість цієї растрової версії для більш якісного відображення.

File:Newton iteration.png → File:Newton iteration.svg

Щоб дізнатися більше про векторну графіку, прочитайте статтю «Перетворення зображень у формат SVG».
Також доступна інформація про підтримку формату SVG у MediaWiki.
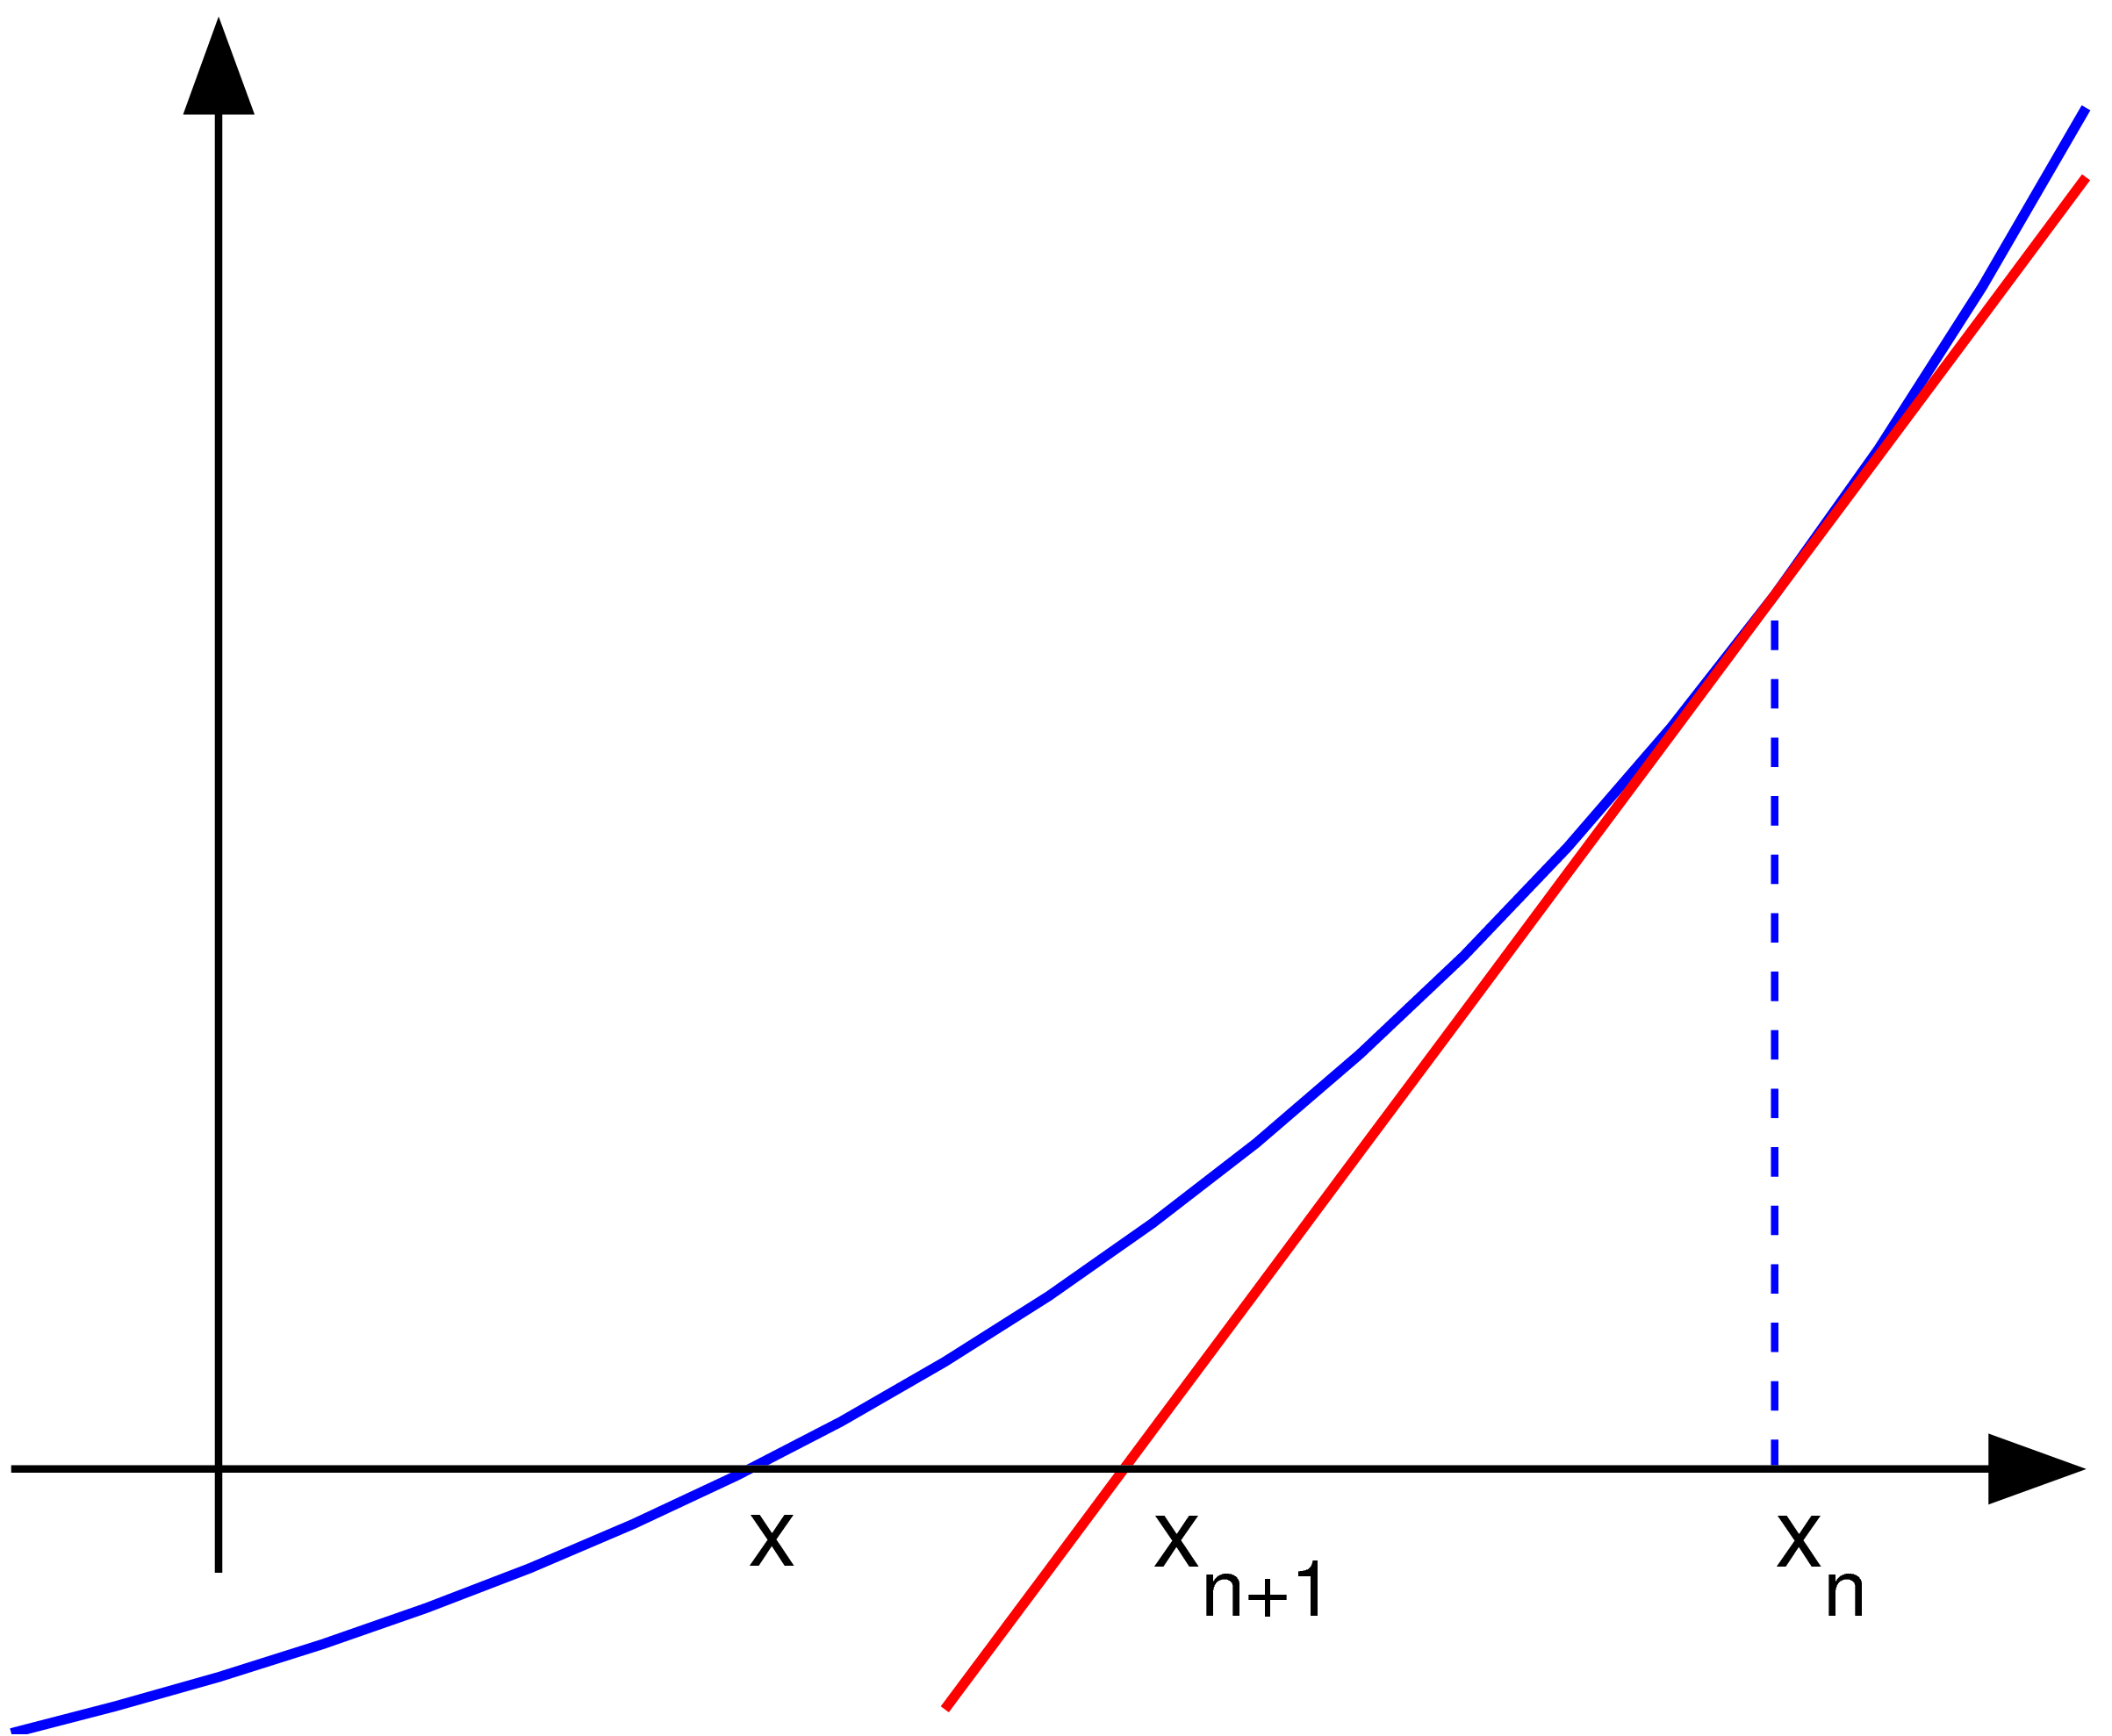
На інших мовах
Alemannisch  Bahasa Indonesia  Bahasa Melayu  British English  català  čeština  dansk  Deutsch  eesti  English  español  Esperanto  euskara  français  Frysk  galego  hrvatski  Ido  italiano  lietuvių  magyar  Nederlands  norsk bokmål  norsk nynorsk  occitan  Plattdüütsch  polski  português  português do Brasil  română  Scots  sicilianu  slovenčina  slovenščina  suomi  svenska  Tiếng Việt  Türkçe  vèneto  Ελληνικά  беларуская (тарашкевіца)  български  македонски  нохчийн  русский  српски / srpski  татарча/tatarça  українська  ქართული  հայերեն  বাংলা  தமிழ்  മലയാളം  ไทย  한국어  日本語  简体中文  繁體中文  עברית  العربية  فارسی  +/−
Нове зображення

Опис Uploader graphed this with en:MATLAB (Illustration of en:Newton's method)
Час створення 22 листопада 2004 (first version); 2004-11-23 (last version)
Джерело Перенесено з en.wikipedia на Вікісховище.
Автор Olegalexandrov з англійська Вікіпедія
PNG розвиток
InfoField
 
Це PNG графічне зображення було створено з допомогою MATLAB
Сирцевий код
InfoField

MATLAB code

(Newton iteration)
% illustration of Newton's method for finding a zero of a function

function main ()
   
a=-1; b=1;   % interval endpoints
fs=20;       % text font size

% arrows settings
thickness1=2; thickness2=1.5; arrowsize=0.1; arrow_type=1;
angle=20; % in degrees

h=0.1;  % grid size
X=a:h:b; % points on the x axis
f=inline('exp(x)/1.5-0.5');   % function to plot
g=inline('exp(x)/1.5');       % derivative of f
x0=0.7; y0=f(x0);             % point at which to draw the tangent line 
m=g(x0);
Y=f(X);                       % points on the function to plot
XT=-0.1:h:b; YT=y0+(XT-x0)*m; % tangent line

% prepare the screen
clf; hold on; axis equal; axis off

% plot the graph and the tangent lines
plot(X, Y, 'linewidth', thickness1)
plot(XT, YT, 'r', 'linewidth', thickness1)
plot([x0 x0], [0, y0], '--', 'linewidth', thickness2)

% axes
small=0.2;
arrow([a 0], [b, 0], thickness2, arrowsize, angle, arrow_type, [0, 0, 0])
arrow([a+small, -0.1], [a+small, 1.4], thickness2, arrowsize, angle, arrow_type, [0, 0, 0])

% text
H=text(-0.29, -0.06,  'x'); set(H, 'fontsize', fs)
H=text(0.1, -0.1,  'x_{n+1}'); set(H, 'fontsize', fs)
H=text(0.7, -0.1,  'x_{n}'); set(H, 'fontsize', fs)

% save to disk
saveas(gcf, 'newton_iteration.eps', 'psc2')

function arrow(start, stop, thickness, arrow_size, sharpness, arrow_type, color)

% Function arguments:
% start, stop:  start and end coordinates of arrow, vectors of size 2
% thickness:    thickness of arrow stick
% arrow_size:   the size of the two sides of the angle in this picture ->
% sharpness:    angle between the arrow stick and arrow side, in degrees
% arrow_type:   1 for filled arrow, otherwise the arrow will be just two segments
% color:        arrow color, a vector of length three with values in [0, 1]

% convert to complex numbers
   i=sqrt(-1);
   start=start(1)+i*start(2); stop=stop(1)+i*stop(2);
   rotate_angle=exp(i*pi*sharpness/180);

% points making up the arrow tip (besides the "stop" point)
   point1 = stop - (arrow_size*rotate_angle)*(stop-start)/abs(stop-start);
   point2 = stop - (arrow_size/rotate_angle)*(stop-start)/abs(stop-start);

   if arrow_type==1 % filled arrow

      % plot the stick, but not till the end, looks bad
      t=0.5*arrow_size*cos(pi*sharpness/180)/abs(stop-start); stop1=t*start+(1-t)*stop;
      plot(real([start, stop1]), imag([start, stop1]), 'LineWidth', thickness, 'Color', color);

      % fill the arrow
      H=fill(real([stop, point1, point2]), imag([stop, point1, point2]), color);
      set(H, 'EdgeColor', 'none')

   else % two-segment arrow
      plot(real([start, stop]), imag([start, stop]),   'LineWidth', thickness, 'Color', color);
      plot(real([stop, point1]), imag([stop, point1]), 'LineWidth', thickness, 'Color', color);
      plot(real([stop, point2]), imag([stop, point2]), 'LineWidth', thickness, 'Color', color);
   end

Ліцензування

Public domain Ця робота була передана у суспільне надбання її автором, Olegalexandrov з англійська Вікіпедія. Це застосовується по всьому світу.
У деяких країнах це не може бути юридично можливо, в такому випадку:
Olegalexandrov дає кожному право на використання цієї роботи для будь-яких цілей, без будь-яких умов, якщо такі умови не вимагаються за законом.


Журнал завантажень локального файлу

Оригінальна сторінка опису знаходилась тут. Усі нижчезазначені імена користувачів стосуються en.wikipedia.
  • 2004-11-23 19:55 Olegalexandrov 405×340×8 (14290 bytes) Scaled down the picture of Newton's method
  • 2004-11-22 21:34 Olegalexandrov 509×406×8 (16510 bytes) I graphed this with Matlab (Illustration of Newton's method) {{PD}}

Підписи

Додайте однорядкове пояснення, що саме репрезентує цей файл

Об'єкти, показані на цьому файлі

зображує

Історія файлу

Клацніть на дату/час, щоб переглянути, як тоді виглядав файл.

Дата/часМініатюраРозмір об'єктаКористувачКоментар
поточний03:23, 25 травня 2007Мініатюра для версії від 03:23, 25 травня 20072406 × 1978 (55 КБ)Oleg Alexandrov{{Information |Description=Uploader graphed this with en:MATLAB (Illustration of en:Newton's method) ==Source code== <pre> <nowiki> % illustration of Newton's method for finding a zero of a function function main () a=-1; b=1; % interva
23:11, 12 червня 2005Мініатюра для версії від 23:11, 12 червня 2005405 × 340 (6 КБ)Everlongoptimized for smaller file size
23:06, 17 січня 2005Мініатюра для версії від 23:06, 17 січня 2005405 × 340 (14 КБ)Andreas Ipp~commonswiki{{PD}}: Original author graphed this with MATLAB (Illustration of Newton's method), from Wikipedia.

Нема сторінок, що використовують цей файл.

Глобальне використання файлу

Цей файл використовують такі інші вікі: